
Monitoring Miners From a Phone Without Losing Detail
A phone screen forces a choice between resolution and readability, and most mining apps resolve it in the wrong direction. At difficulty 132.76 T, 1 PH/s settles about 0.0000187 BTC an hour — roughly $1.58 — which means a 1% hashrate shortfall costs about $0.38 a day and can be spotted within a single hourly cycle if the app shows it.

Key takeaways
- Sampling resolution decides what you can see: hourly settlement at 1 PH/s produces steps of about 0.0000187 BTC, so a shortfall that lasts one cycle is measurable, and one that lasts eight hours is already gone.
- A 2% realised-hashrate shortfall on a 200 TH/s rig is about $0.15 a day — around $4.56 a month — invisible in a monthly total and obvious in a worker-level view.
- The two variables that matter are granularity (per-worker, not per-account) and alert latency (push, not pull). Everything else can be a summary.
- Phones are for detection; reconciliations still belong in a table. Keep the detailed view where you can compare days, not inches.
Context in 2026
Monitoring has become a revenue feature rather than a convenience, for a simple reason: at current difficulty the cost of downtimes is proportional to hashrate, and hashrate per operator has risen. Difficulty stood at 132.76 T with network hashrate around 1,003 EH/s when these figures were read, and the network issues 450 BTC a day across 144 blocks. With BTC at $84,692, that is roughly $38.1 million a day of production, allocated in proportion to credited shares.
Credited shares only exist while machines are online and performing. So the practical question for anyone running more than a couple of rigs is not "what is my daily income" but "what proportion of my nominal hashrate was actually credited in the last 24 hours". The first number is on every dashboard; the second one requires a worker-level view and a reference figure to compare against.
The two variables that matter
Granularity. Aggregation is the enemy of diagnosis. If an account shows 1 PH/s and eight of ten machines are running at nameplate while two are throttled, the total still looks plausible — it just drifts. Per-worker realised hashrate converts that drift into two rows you can act on, which is why a mobile mining dashboard should default to the worker list rather than a single account curve.
Alert latency. A long-delay alert is a report, not a warning. Push notifications that arrive within minutes of a worker dropping are what turn monitoring into a control loop; the same information discovered at the end of the month is an accounting entry. This is also where threshold discipline matters — alerts that fire constantly get muted, and a muted app provides no coverage at all.
A third variable is worth naming even though it changes less often: continuity. Monitoring only helps if the numbers mean the same thing from one day to the next. Changing pools resets the history you rely on to judge whether a rig's output is drifting or normal, which is an argument for treating pool selection as a longer-term decision than a monthly optimisation.
| Layer | Catches | Blind spot |
|---|---|---|
| Account-level hashrate total | Pool-wide outages, connection loss | Individual throttling: a 2% shortfall at 200 TH/s is $4.56 a month |
| Per-worker realised hashrate | Dead machines, thermal throttling, failing PSUs | Nothing structural — this is the layer that localises faults |
| Push alerts with thresholds | Faults within minutes of occurring | Nothing if thresholds are tuned; everything if they are muted |
| Settlement history | Fee attachment, cadence, thresholds and payout delays | Nothing, but it needs a table view to be readable |
| Wallet and conversion view | Where the coins actually landed | Nothing if deposits and balances are visible in the same account |
Numbers from a real rig
Take a 200 TH/s machine. At 132.76 T it produces 0.00008972 BTC a day, which is $7.60 at $84,692; net of the listed 4% fee on the block-reward component, $7.29. Its power draw at 20 J/TH is 4 kW, or 96 kWh a day — about $5.76 at $0.06/kWh — leaving roughly $1.53 a day of margin.
Now introduce a fault that a phone is uniquely good at catching: a partially blocked intake, a fan bearing failing, a firmware update that resets the frequency. The machine keeps running and keeps drawing full power, but its realised hashrate settles 2% lower. On this rig that is about $0.15 a day, $4.56 a month, and it does not stop until someone notices. Scale the same 2% to a 1 PH/s account and the figure becomes about $0.76 a day — roughly $23 a month — from a fault that never triggers an outage alarm.
The hourly settlement cycle is what makes this visible. Under PPS+ the pool pays hourly against current difficulty, so each hour produces a discrete step in the balance. At 1 PH/s each step is about 0.0000187 BTC, or $1.58. A step that comes in 2% light is a data point, not an anecdote, and it can be detected the same day instead of at month end.
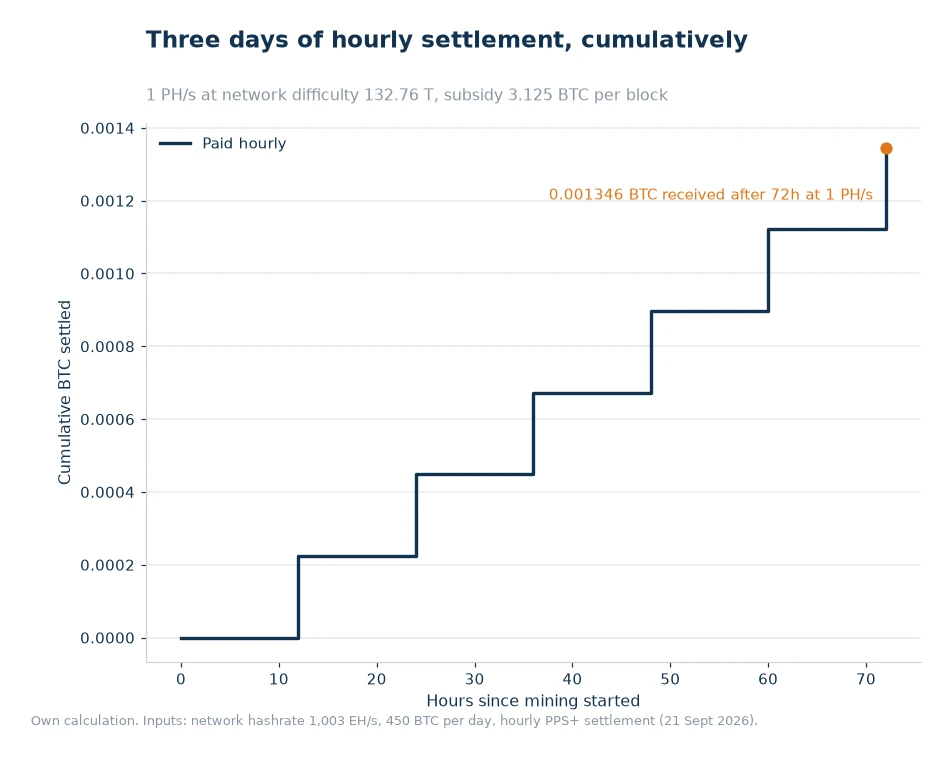
The chart also shows where a phone view has limits. Seventy-two hourly cycles produce a staircase that is easy to read as a shape and hard to read as numbers — which is the correct division of labour. Use the phone for the shape and for alerts; open the detailed view when the shape changes. A mining pool account that keeps mining statistics, settlement records and wallet balances together makes that switch trivial, because nothing needs to be exported or compared across two providers.
Decision guide
- Set a reference figure per worker. Write down nameplate hashrate for every machine. Without a reference, a 2% drift is invisible by definition.
- Check realised hashrate daily for one week after any change. Firmware updates, cable swaps and ambient temperature shifts all show up in the first 24 hours.
- Tune one alert, then stop. Zero-hashrate workers and a realised-rate threshold below your chosen fraction of nameplate are usually enough for a small fleet.
- Review the settlement staircase weekly. A gap or a light step in the last three days should have an explanation.
- Keep the money view separate from the machine view. Confirm balances and conversion in the multi-currency wallet your account provides, and install the iOS or Android app from the pool's own ViaBTC App Download page rather than a link from anywhere else.
Frequently asked questions
Is a bigger pool always better?
Size reduces payout variance but also concentrates hashrate. What matters more is fee structure, uptime, latency and payout cadence.
What happens if my miner goes offline?
Shares stop, so expected income stops with them. Alerts and a dashboard that shows per-worker hashrate shorten the gap between a failure and a fix.
Can a phone really show enough detail?
Enough to detect problems, not enough to audit them. Per-worker realised hashrate and push alerts fit a small screen well; multi-day settlement comparisons and payout reconciliation are better on a larger view. The phone's job is to shorten the time between a fault and a fix, which is worth about $0.15 a day for a 2% shortfall on 200 TH/s and considerably more at scale.
The short version
Monitoring from a phone works when it is designed around two variables: per-worker granularity and alert latency. Show the worker list first, set one threshold that describes a real failure, and use the hourly settlement staircase as a weekly sanity check. Everything else — colourful aggregate curves, price widgets, engagement features — can wait, because none of them recover the $4.56 a month that a throttled rig quietly costs.
Data and sources: ViaBTC pricing[1] and the ViaBTC fee breakdown[2]. Network difficulty, network hashrate and the BTC price of $84,692 were read from public chain data and market feeds on 21 September 2026; income figures use hashrate ÷ network hashrate × 450 BTC × (1 − fee). Power cost assumes 20 J/TH hardware at $0.06/kWh and is illustrative.